Wednesday, December 29, 2010

Dehaier Medical Systems Limited : A Shining Star in Medical Device Market

Since I published an article on China Kanghui Holdings (KH) a few months ago, KH has outperformed market by double digits. It had soared from $12 to $23 and is trading around $18 now, 50% higher than my initial recommendation. In a world where many investors are fleeing from hot Chinese IPOs with high valuation matrix, I looked at Chinese small cap stocks and found another well undervalued gem: Dehaier Medical Systems Limited (DHRM).
DHRM is a leading distributor and self-branded provider of medical devices based in Beijing, China. DHRM designs, develops, and markets self-branded homecare medical products (oxygen homecare products) and distributes products manufactured by other companies.
The Chinese government is well aware that the current health care facilities infrastructure and investments made are highly inadequate to cope with the growing needs of the population. Hence, in 2009 the central government decided to disburse an estimated RMB 850 billion (USD 124 billion) over the next three years. This included an estimated RMB 4.1 billion (USD 620 million) to be disbursed for the setting up of CHC (Community Health Centers) and for the purchase of medical devices. A recent report published by the Wharton School of Business, University of Pennsylvania suggests that the expected value of China’s medical device market will reach $28 billion by 2014, representing a 15% CAGR. Because of increasing availability of health care insurance, increasing percentage of GDP to be spent on health care by the government, and growing desire for better quality of care, the medical device market is projected to grow much faster than the global medical device market. Within the next five to seven years, China is expected to surpass Japan and become the second largest medical device market in the world.
With such strong government emphasis and massive investments committed, DHRM has become one of the fastest-growing medical device companies in China today. The company has managed to maintain revenue growth of 35% annually for the past three years and has controlled expenses well. In fact, the profit margin for monitoring devices, one of the key products offered by DHRM, increased from 31.1% in 1H 2009 to 52.1% in 1H 2010 due to effective cost control.
In China, hospitals and clinics purchase almost all of their medical devices and supplies  through distributors. As a result, medical device companies need to develop relationships with several distributors in different regions. DHRM has contractual relationships with over 2000 independent distributors and business relationships with over 3000 hospitals throughout China. Very recently, DHRM had won a $2 million medical device distribution bid for a new rural healthcare construction project supported by the China Development Bank Corp ("CDB"), a major Chinese state-owned bank focused on supporting China's national infrastructure development initiatives. Under the terms of the contract, Dehaier will cooperate with Philips Medical Systems, Olympus Corporation of Japan and many other companies to distribute medical devices to the new healthcare facility. Winning this project gives DHRM entry into the basic-level medical care market and DHRM expects to obtain more projects within this optimal environment. DHRM also established the Customer Experience Center (CEC) network for its Homecare Medical products. The CECs are established to provide broad ranges of branded Homecare Medical products and to meet customer’s expectations, e.g., real time recording system, diversified solutions and treatments etc.
In the recent quarterly report, the company reported a net income of $3.1 million in the first nine months of 2010, up 48% year from the previous year. DHRM also earned $0.77 per share, compared with EPS of $0.69 achieved in the same period a year ago. DHRM is currently traded around $5 at P/E less than five and has the lowest valuation compared to the industry as shown below.


DHRM
Healthcare-Medical
Appliances & Equipment
P/E(TTM)
4.8
19.6
P/B
2.9
2.9
P/S
1.1
2.6
Operating Margin(TTM)
28.30%
20.10%
Net Margin(TTM)
22.90%
10.40%
ROE(TTM)
29.20%
12.30%
Debt/Equity
0.07
0.7

 
DHRM has an extensive marketing network and stable relationships with old customers. It also enhanced its ability to control risk by decreasing dependence on major customers. Because of a strong government support in the medical industry and the direction of healthcare shifting towards community-centric healthcare in China, DHRM’s strong growth trend is expected to continue. In my opinion, DHRM is a well under-valued stock and the current price is definitely a bargain.
Tuesday, December 21, 2010

SkyPeople Fruit Juice: The best beverage stock in the world

SkyPeople Fruit Juice, Inc. (SPU) produces kiwi, apple, pear, jujube and mulberry concentrated fruit juices and fruit juice beverages as well as fresh fruit. It also owns the largest kiwifruit plantation in Asia. As a result, SPU is one of the fastest-growing fruit product companies in China today. The company rode out the financial crisis and has managed to maintain revenue growth of 40% annually for the past four years.
From September to October of 2010, concentrated fruit juice prices have risen from $850 to $1,600 per ton. Due to production cuts in apples from Europe, the price of apple juice in Portland has already increased more than 20%, and the price of apple juice in China is expected to reach $1,800 a ton in the near future.
China consumed 12.5 billion kiloliters of fruit and vegetable juice in 2009, according to Euromonitor International, and this figure is likely to reach 18.1 billion kiloliters within three years. Double-digit growth is therefore likely to remain a feature of the market for some time. In the long run, the future of concentrated fruit juice is very bright due to growing domestic demand. Sales of fruit juice beverages continue to benefit from strong demand from Chinese consumers as more middle-class consumers now drink fruit juices as a healthy alternative to carbonated soft drinks. In the short term, due to expectations of high inflation ahead, rising price will become the catalyst boosting stock prices for fruit juice companies.
First: Two major exporters – China and Portland – are facing inventory reduction and supply shortage problems today. China is currently the world’s largest producer of apple concentrate around the world, with 95% of its annual output exported overseas. FOODNEWS showed that there will be a shortage of concentrated apple juice in China because of rising price.
Second: Orange Juice, once considered to be the substitute of apple juice, also experienced a sharp increase in price. The price of orange juice increased more than 50% in 2009 because of a freezing disaster in the United States, one of the major orange exporters. The price of orange juice has remained above $3,000 per ton due to tight inventories in 2010. As a substitute for orange juice, the rising price of orange juice will definitely increase the demand for apple juice.
SPU is a small-cap company but its strength lies in its diversity. Huiyuan, the largest domestic fruit juice producer, and other peers in China mainly specialize in apple- and orange-related products. SPU, unlike its peers, however, specialized in kiwi juice, which has a much wider profit margin than apple- and orange-related products. Earlier this year, SPU introduced a bottled kiwifruit and mulberry juice under the brand name of Hedetang in Beijing. This helped the company to avoid direct competition with major players like Huiyuan (1886.HK) in China, which mainly produces orange and apple juices. 
In the recent quarterly report, the company reported a net income of $3.6 million, up 71.4% from 3Q 2009, and revenues from kiwifruit and apple concentrates increased 207.6% and 117.6%, respectively, on a yearly basis. Apple and orange concentrated juice   are the most profitable products in SkyPeople’s portfolio. They account for 60% of total revenue in the first 9 months of 2010 and continue to enjoy the rising price in today’s fruit market.
As of September 30th, 2010, the company had US$46.1 million in cash from strong internal cash flows, and its total liability is only $22.3 million. The company’s rich cash position, as well as its strong relationships with local lending institutions, provides SPU adequate funds to support its growth plans.
Because of the strong financial reports and rising demand for its product, SPU recently updated its net income and earnings per share guidance for 2010. The GAAP EPS (diluted) is $0.82 to $0.91, which means the stock is traded at P/E less than 5 today! The price-to-book ratio of SPU is 0.99 with a PEG Ratio of 0.15, which is relatively low and suggests that SPU is a significantly undervalued company with great growth potential.

Considering the huge growth potential of China’s fruit industry, increased fruit beverage consumption and SPU’s strong past performance, SkyPeople Fruit Juice definitely represents a great opportunity for value investors.    

Monday, December 13, 2010

China Ming Yang: Gone with the wind or Fly with the wind?

China Ming Yang Wind Power (MY) announced fantastic results for the past quarter and beat all consensus estimates. However, its share price showed downward momentum and recently traded in the lower 10s. According to Benjamin Graham, the stock’s owners should not be too concerned with erratic fluctuations in stock prices, because the stock market behaves like a voting machine in the short term but acts like a weighing machine in the long term (i.e., the stock’s true value will be reflected in its price over the long run). Instead of viewing MY as an underdog, I believe its current price in the lower 10s provides value investors a very attractive entry value.
 
China’s 12th Five-Year Plan presents an exciting renewable energy plan. It states that the installed capacity of wind power will reach 100 million kW by 2015 and 180 million kW by 2020, which suggests roughly 12 GW of newly installed capacity annually. Ming Yang will benefit from these supportive policies as a leading WTG manufacturing company in China. There are also two key wind power development areas: onshore, including Inner Mongolia and Xinjiang, and offshore, including Jiangsu, Hebei, and so on. Because Ming Yang has also secured wind resources in these key wind power development areas, the long-term relationship with wind farm developers in these areas will definitely boost Ming Yang’s sales in the near future.
In previous articles, I have provided some background on Ming Yang; I will focus on valuation in this article.
 
Valuation
Most financial resources show Ming Yang’s trailing P/E as 18, which makes it look like an overvalued stock. However, it should be pointed out that MY just became profitable in 2010, so its negative earnings in Q4 2009 adversely affected the calculation of its trailing P/E.
In fact, MY has earned US$0.71 in the first nine months of 2010, compared to a net loss of US$0.2 for the same period in 2009.
 
MY’s latest quarterly report shows that the company is aiming to achieve revenue recognition of an estimated 800 1.5 MW WTG units in 2010, and is also targeting an estimated 1400 1.5 MW WTG units and 100 3.0 MW SCD units in 2011.
 
I will show my calculation of estimated revenues for MY in both 2010 and 2011, based on the above information, in the following steps:
1.       Calculation of unit price for 1.5 MW WTG units.
According to the latest quarterly report, the total recognized revenue in the third quarter of 2010 was US$ 222.1 million (RMB 1486.0 million), based on 239 1.5 MW units with an exchange rate of 6.69 RMB/USD. The unit price for 1.5 MW WTG units is $222.1 million ÷ 239 = $0.9293 million/unit.
2.       Calculation of unit price for 3.0 MW SCD units.
On December 7, 2010, MY announced that it had won its bid for a government authorized wind farm project in the Hami area of Xinjiang Uyghur Autonomous Region, China. Ming Yang’s winning bid is equivalent to 67 units of 3.0 MW SCD WTGs with an awarded total contract value of RMB 824 million. Based on an exchange rate of 6.69 RMB/USD, the contract value is $123.2 million and the unit price for 3.0 MW SCD units can be calculated as 123.2 ÷ 67 = $1.8383 million/unit.
3.       Now we can easily estimate that the revenue for MY in 2010 will be 800 x 0.9293 = $743.4 million and (1400 x 0.9293) + (10 x 1.8383) = $1484.9 million in 2011.
 
 
As of September 30, 2010, 4.6 million shares are issued upon the exercise of share options, which were granted to certain directors and employees in Ming Yang. If all of these options were exercised, the net book value per share would decrease to US$ 10.28. Adding back the 125 million common shares, the diluted shares for MY is 125 + 4.6 = 129.6 million.
 
Finally, excluding IPO costs, the net margin per share for MY is 16%. Therefore, we can calculate the net income for MY in 2010 as 743.4*16%/129.6 = $0.92 and 1484.9*16%/129.6 = $1.83 in 2011.
Considering MY’s closing price of 9.9, P/E in 2010 is 11 and forward P/E in 2011 is only 5.5.
 
The order backlog of MY increased to 1,331 units and 363 units (not yet signed) as of September 30, 2010. The cumulative WTGs commissioned in 2010 totals 549 units. The strong demand for MY’s wind turbines and order backlog, together with orders awarded but yet to be signed, makes me feel confident that MY will achieve its revenue target.
 
Goldwind (002202.SZ) is a state-owned pure wind turbine supplier in China and can be seen as MY’s most comparable peer. Goldwind is now trading at 32 trailing P/E and 15 forward P/E.
 
The financial statement for MY is audited by KPMG, one of the “Big 4,” and therefore the credibility of the financial data is ensured. Considering the supportive policies made by the Chinese government and improving profitability from MY, I believe that MY with P/E less than six is obviously an undervalued stock.

Tuesday, November 16, 2010

Top Three Reasons to Buy China MingYang Wind Energy

On November 15th, 2010, China Ming Yang Wind Power (MY) reported its third quarter results for 2010. Shares jumped as much as 14% in early trading after the earnings were released, but the stock pulled back throughout the later trading hours. If there are no material events, I consider MY to be a significantly undervalued stock. In this article, I want to provide my top three reasons to long MY following my previous article.
  1. Strong Financial Highlights
Unit (RMB) 2009-Q12009-Q22009-Q32009-Q42010-Q12010-Q22010-Q3
Revenue149576451989231159339968100807413105361485963
Gross Profit397244322584241722206758249050248654
Diluted (loss) earnings / share-0.32-0.51-0.49-0.91.371.611.7
The above table represents the quarterly results of operations for the quarters in the period from March 31st, 2009 to September 30th, 2010 inclusive. Financial highlights are summarized below:
  • Total revenue increased by 543% over Q3 2009, to RMB 1,486.0 million ($222.1 million).
  • Gross profit increased by 862% over Q3 2009, to RMB 248.7 million ($37.2 million), which is well above the analysts’ estimates of RMB 113-142 million. Gross margin also increased to 16.7% compared to 11.2% for Q3 2009, above analysts’ estimates of 16.5%. The Q3 2010 gross margin is lower than the 19.0% in Q2 2010, due to the sales contract mix in Q3 2010, and should bounce back to over 18% in Q4 2010.
  • Basic and diluted earnings per ordinary share were RMB 1.70 ($0.25) compared with basic and diluted loss per share of RMB 0.49 for the same period in 2009. The most recent analysts’ consensus for FY 2010 is in the range of 0.69 to 0.72. In fact, MY already earned an EPS of $0.69 in the first nine month of 2010 and could easily beat these estimates by several cents.
The quarterly results of operations from MY are affected by seasonal trends. Since customers typically award winning bids for wind farm projects in the first and fourth quarters of each year, the cost of sales in MY is typically higher in the second and third quarters of each year.
It is reasonable to assume MY‘s fourth quarter results will be at least as good as those from the third quarter. This assumption gives an estimate of $0.94 for 2010 EPS. Considering the current closing price of $10.60, P/E in 2010 is only 11, which suggests that MY is significantly undervalued. If we consider that secured sales orders have doubled in the past twelve months and that the sales revenues are not recognized yet, the forward P/E of MY is around 7. MY’s direct competitor, Goldwind, is trading at 15x P/E.
  1. Good “Guanxi” With Chinese Governemnt
“Guanxi” literally means "relationships." In China, the right "Guanxi" makes all the difference in ensuring that a business will be successful. MY has very good “Guanxi” with government and some evidence is shown below:
  • A total of 66 investment projects were reported to the Chinese central government this year, for 5.7 billion RMB, and Ming Yang received 60 million RMB to support its business.Ming Yang received 51 sets of SCD wind turbine orders from the government.
  • In addition, Ming Yang has signed offshore wind farm development agreements with the government of Rudong county, Jiangsu Province, and two new energy subsidiaries of China Huadian Corporation ("Huadian") and China Huaneng Group ("Huaneng") (HNP), two of China's largest wind power developers.
  • On the evening of Oct. 29, 2010, MingYang held a celebration of its successful listing on the NYSE in the United States in Beijing’s Great Hall. This is very rare for a non-state-owned company. Among the companies that were allowed to hold celebrations of listing on a major exchange in Beijing’s Great Hall are the Industrial and Commercial Bank (ICBC), and China Railway, which are state owned enterprises with good “Guanxi” with the government.
  • The newly released 12th Five-Year Plan of China (2011-2015) aims to boost the development of strategic emerging industries, and Beijing will provide 4 trillion RMB ($600 billion) to financially support key emerging industries, including wind, solar, biological, new-energy automobiles, etc.
  1. Coverage From Top Analysts
The joint bookrunners for MY are Morgan Stanley (MS), Merrill Lynch and Credit Suisse (CS). Now the quiet period for IPOs has ended, analysts are beginning to add coverage for this stock. During the last five days, Morgan Stanley started China Mingyang at “Overweight” with a target of $15.40. Merrill Lynch started MY at “Buy” with a target of $17 while Credit Suisse started MY at “Outperform” with a target of $16.10. The current price level offers a huge discount compared to the consensus estimate from analysts and is an optimistic sign for MY.

There are two important attributes that define value investing, according to Michael F. Price, the 271st richest person in the world and a renowned money manager who has earned a reputation for buying undervalued companies. One is patience and the other is focus; this means that one should not be distracted by global or macro forecasts. It is always easier to understand a security than an economy and using this understanding leads the way to profit.

At the current price level, MY is a significantly undervalued stock and offers a price with a discount large enough to allow for a margin of safety. The business of MY is the manufacture and sale of wind turbines and is easily understood. As a technology leader in China’s wind power equipment industry, MY will benefit from the new policies and is well positioned to capture a large share of the fast growing wind energy market in China. With strong sales figures for wind turbine orders and increased demand for wind energy in China, I believe that MY offers a fantastic investment opportunity.

Wednesday, November 3, 2010

Le Gaga: Veggie Lover's favorite

Le Gaga Holdings, Limited (GAGA) is one of the largest greenhouse vegetable producers and one of the fastest growing major vegetable producers in China. Gaga grows vegetables in open fields and greenhouses, and focuses on applying advanced agricultural techniques to grow safe and consistently high-quality vegetables. Over 100 varieties of vegetables are sold to wholesalers, institutional customers and supermarket chains in China and Hong Kong. Their customers include Walmart, the largest grocery retailer in the world, and the top three Hong Kong supermarket chains, Wellcome, ParknShop and Vanguard.
 
As one Chinese proverb suggests, “Hunger breeds discontent.” Agriculture has always been a very important industry in China and contributed 18.1% of China’s GDP in 2009. The largest component of the agricultural industry is farming, contributing 47.7% of the sector’s output, according to Frost & Sullivan. The farming industry in China includes the farming of vegetables, grain, fruit, tea, cotton and other crops.

China is the largest global producer of vegetables by volume. In 2009, China’s vegetable production reached RMB 875.8 billion, and this amount is expected to increase to RMB 1,286.5 billion in 2014. China’s large vegetable production output is due to the availability of arable lands. Vegetables are indispensable ingredients in Chinese cuisine, and China has consistently high vegetable consumption. The idea of a vegetarian diet is stressed by China’s traditional religions, such as Taoism and Buddhism, and welcomed by the Chinese people.
 
Over the past four years, vegetable prices have steadily risen in China and the trends are expected to continue. For example, the wholesale price of cabbage is 10 times more expensive now than it was in 2009.  Since October, 2010, the price of cabbage has gone up nearly 40% within only ten days in Shouguang, Shangdong Province, China’s largest vegetable distributor. Very recently, the KimChi Crisis in South Korea became the catalyst to boost the price of cabbage in China.
 
“In order to obtain a good profit, the key is to develop planting plans," said Mr.  Ma Chengrong, CEO of GAGA, during an interview with financial media: GAGA has developed an effective and comprehensive database to store sales, seed, and vegetable production information in target markets and accumulated valuable proprietary knowledge through years of research and development. A strong brand has been built on the superior quality and safety of GAGA’s produce and the reliability of their supply.
 
The table below shows the operation data for GAGA between 2008 and 2010.
 
2008
2009
2010
Unit
Total arable land area
17103
16525
18850
Mu
Greenhouse Land Area/Total Arable Land area
15.60%
18.90%
23.40%
 
Total production output
57085
69240
98076
Tonnes
Production Yield
3.6
3.9
5.4
Tonnes/Mu
Revenue Per Mu
9611
11167
15497
RMB

As we can see from the above table, the greenhouse land area had grown rapidly to cover 23.4% of total arable land area. The revenue per mu also increased significantly, changing from 9611 RMB to 15497 RMB, representing a CAGR of 17.3%.
 
The latest SEC filing also shows that the company’s revenue had increased 35% year over year to 280 million RMB ($41 million) and profit for the year soared 79% to 110 million RMB ($16.3 million).
 
Agriculture is supported by China’s national policy and the growth of the domestic vegetable market is very large. With the continuous improvement of quality of life of ordinary people, the demand for high-quality brand of vegetables will also increase and offer a fantastic return for the GAGA shareholders.
 
The double benefit of GAGA is of course the stronger Chinese Yuan. The revenues and costs in GAGA are mostly denominated in the Renminbi, and a significant portion of financial assets are also denominated in the Renminbi. According to a note issued by Auriga this week, total scale of Yuan appreciation is estimated to be between 25% and 40% in five years. Those picking U.S.-listed Chinese stocks that are focused on domestic consumption, such as GAGA in the agriculture industry, will be generously rewarded. In the short term, I expect GAGA to reach $13-15 and $20-22 in the next two years.

Wednesday, October 27, 2010

China Ming Yang: A Clean Star with huge growth potentials

China Ming Yang Wind Power Group limited is the largest non-state owned wind turbine manufacturer in China. The Guangdong-based company focuses on designing, manufacturing, selling and servicing wind turbines. It has established customer relationships with leading Chinese state-owned and local power producers.

Wind power technology is cost efficient and mature compared to other renewable energy technologies. According to Global Wind Energy Council, wind power is one of the fastest growing renewable energy technologies in the world.
 
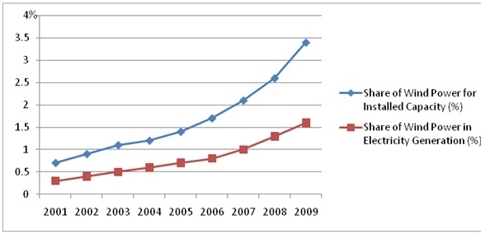
As one Chinese proverb suggests, a picture is worth a thousand words. Let us see one graph as shown below.


The graph sets forth the growth of wind power compared to total global electricity generation according to BTM-Consult Aps –April, 2010.
BTM estimates that global installed cumulative capacity will increase at a CAGR of 22.8% between 2009 and 2014, reaching 447,689MW by the end of 2014.
Wind power development started in China in the late 1980s, but did not begin to grow significantly until 2005. Total installed wind capacity increased from 406MW in 2001 to 25,853MW in 2009, representing a CAGR of 68.1%. China had advanced to the first and second positions in the world in terms of new and cumulative installed capacity by the end of 2009. The most abundant wind resources along coastal areas and offshore are found in Jiangsu, Shandong, Zhejiang, Fujian and Guangdong, where Ming Yang is located.

According to a list compiled by the global accounting firm Ernst & Young in September 2010, China overtook the U.S. to lead a quarterly index of the most attractive countries for renewable energy projects for the first time. China also topped Ernst & Young’s attractiveness index for investments in wind power.

Ming Yang was consistently losing money over the past two years. However, in the past two quarters, the company has made a strong turn around and has generated great earnings. In the meantime, its domestic market share has increased to become among the five largest domestic-branded wind turbine manufacturers in China by the end of 2009, according to BTM. 


In 2008, the company reported its total revenue as $124.7 million. The revenue then increased significantly to $1.17 billion in 2009. In the first half of 2010, Ming Yang continues to grow with the same momentum as the past year. As of June 30, 2010, its total revenue reached $2.31 billion, which doubled the total earnings in 2009. Compared to the first half of 2009, it has increased 285.43%. The management of the company stated the fast growth is mainly due to the sale of the wind turbines. The sales volume significantly increased from 78 sets to 310 sets.

Although the average selling price of wind turbines dropped from RMB 5,365 per watt in the first half of 2009 to RMB 4,098 per watt in the same period of 2010,

The increase in sales of wind turbines successfully offsets the negative impact of price drop.
If we only look at the trailing P/E ratio, MY is definitely expensive.

 
2009
First Half of 2009
First Half of 2010
Basic EPS
-0.33
-0.124
0.44
Diluted EPS
-0.33
-0.124
0.44

 
From comparison of the basic EPS and diluted EPS, the trailing 12-month PE is 44X. This valuation sounds alarming.
Do we stop here? The answer is no and let us take a second look.
Of course, there is something one has to be especially aware of. China Ming Yang was losing money during 2006 to 2009. The company just turned a loss into a gain in the first half of 2010, achieving earnings of $0.44 per share.
According to SEC filings and other Chinese media, Ming Yang’s second half is very positive because of government support, economies of scale, and strong market penetration.
Mr. Chen, vice president of China Ming Yang Wind Power Group, was interviewed by Reuters at the China Alternative Energy Conference this September and indicated that the revenue guidance was at least RMB 10 billion (US$ 1.52 billion). According to the SEC Filings, MY had earned RMB 2.3 billion (US$ 0.34 billion) in revenue during the six months ended June 30, 2010. The revenue in the guidance has tripled the revenues recorded in the first half of 2010 and showed confidence in management.
 
The latest report issued by Industrial Securities indicated that many owners of civil construction projects at the downstream will begin to work in the fourth quarter of any calendar year. Such seasonal factor will make the fourth quarter the best season for the delivery of wind turbines for MY and other wind turbine manufactures.
If we assume that Ming Yang can achieve the same EPS as first half of 2009 in Q3 and Q4, its total 2010 EPS will be 0.88.
Considering today’s closing price of $10.22, its forward PE is around 12X compared to the industrial average of 24X.
For a growth stock like MY, we can also apply the PEG ratio because it explicitly puts a value on the expected growth in company earnings. Compared to its competitors, MY now has a very attractive valuation as shown below.

Company
Ticker
PEG
China Ming Yang Wind Power Group
MY
0.3
A-Power Energy Generation Syste
APWR
0.6
China Wind Systems, Inc.
CWS
0.4
Xinjiang Goldwind Sci & Tech Co., Ltd
002202.SZ
0.7

 
With technological leadership and improved competitiveness through research and development initiatives, China Ming Yang Power Group aims to compete effectively in China’s wind power equipment industry and offers a fantastic investment opportunity.

Thursday, October 21, 2010

Updates on NEWN: Is it too good to be true or too good to pass up?

In my previous article, I provided my analysis on an under-valued stock NEWN (New Energy Systems). In the current article, I want to detail the rationale for investing in this gem.
There is no doubt that Apple changed the world, ever since their creation of the advertising slogan “Think Different” in 1997. Nowadays, we can see people play with iPods, iPhones, and iPads everywhere. Our kids had one Mac computer at home and then the teachers bought several for the computer lab at the schools. The successful launch of iPad and iPhone allowed the company stock to have a major upturn in the past months with a nice 50% return in 2010. Can we benefit from the rally? In the current article, I want to show you why NEWN is a great candidate to benefit from Apple’s rally.
When people are talking about market gurus, Peter Lynch is a name that usually pops up. During his 13 years of service at Fidelity Magellan Fund, the average return was 29% annually and was a record among mutual fund managers. Lynch is a "story" investor. That is, each stock selection is based on a well-grounded expectation concerning the firm’s growth prospects. The expectations are derived from the company’s "story"; what the company is going to do or what is going to happen to bring about the desired results. I will apply this principle to examine NEWN to see whether it qualifies for great investments. 
  1. What is the company going to do?
China has more than 600 million mobile phone subscribers, making it the country with the largest mobile market on the planet. The soaring demand for mobile power sources, such as lithium ion batteries, has fueled New Energy’s organic growth. New Energy’s wholly owned subsidiary, Shenzhen E’Jenie Technology Development Co., Ltd., has been licensed to manufacture backup power systems and accessories interoperable with Apple’s mobile digital devices. These electronic accessories are designed to connect specially to iPod, iPhone, or iPad respectively and have been certified by the developer to meet Apple performance standards.
 The products will be sold under the MeePower™ brand in the international marketplace and are anticipated to be made available to distributors in the U.S. beginning in late 2010.
  1. What it is going to happen?
As China is switching to a domestic, demand-driven economy, the sales of cell phones, laptops, and the like will grow exponentially. It was the first time that the fourth version of the iPhone had been officially available on the Chinese mainland. In September, 2010, the high demand from people in China had caused China Unicom, the country’s sole iPhone distributor, to stop taking online orders. More than 200,000 preorders were received prior to the launch. The pace of sales outstripped those of the previous iPhone 3, which sold 100,000 after six weeks. The rising demand for fancy Apple products will also fuel New Energy’s growth. In a country with $4 billion of lithium ion battery sales per year, a growing, affluent middle class, and an exciting array of innovative mobile devices, such as the iPhone 4, being introduced into the Chinese market, New Energy is well-positioned to grow through its line of quality products, expanding distribution networks, and accretive acquisitions.
  1. How will the company achieve the desired results?
For the second quarter of 2010, the company’s revenue increased 335.2% to approximately $23.4 million, with the adjusted EPS increased 59.1% to $0.35 per diluted share. These amazing results have led the management team in NEWN to reaffirm its revenue guidance of at least $88 million and adjusted net income guidance of at least $15.6 million, or $1.23 per share, for 2010. This is a huge opportunity for NEWN.
NEWN now has a very attractive valuation compared to its peers as shown below.
 

Company
Ticker
P/E
P/B
New Energy Systems Group
NEWN
4.9
1.2
Advanced Battery Tech.
ABAT
8.3
1.8
China BAK Battery
CBAK
N/A
0.8
China Ritar Power Corp
CRTP
7.4
1.4
Hong Kong Highpower
HPJ
8.5
2.1


With strong sales figures for Apple's products and increased demand for its accessories, I believe that NEWN offers a fantastic investment opportunity. My target price for NEWN is $12
15 for the short term and $2025 in the next two years.
If you can buy them now at $6, you may be able to bring a next-generation iPad back home with you in 2011, as well as your original investment.

Tuesday, September 14, 2010

My instantblog on SeekingAlpha!

http://seekingalpha.com/author/andy-li/instablog
Turn tuned!

A Bright and Shining Star in the IPO Market - KH

Kanghui Holdings (NYSE: KH) is a leading domestic developer, manufacturer and marketer of orthopedic implant products in China. They sell two primary lines of proprietary orthopedic implant products, trauma and spine, with more than 30 product series covering a wide array of orthopedic implants and associated instruments. Trauma products include nails, plates and screws used in bone fracture surgery. It also makes meshes and interbody cages, as well as fixation systems for spines.
According to Frost & Sullivan, the global orthopedic implant market is set to grow from US$12.9 billion in 2006 to US$27.7 billion by 2015, representing a CAGR of 8.1%. The Asia Pacific region is expected to become the most important geographic region for growth in the global orthopedic implant market in the coming years, and the rapid growth in the China and India markets is a principal factor for this overall growth. China’s orthopedic implant market grew from RMB4.4 billion in 2007 to RMB6.1 billion in 2009, representing a CAGR of 18.4%, and is expected to grow to RMB16.6 billion in 2015, representing a CAGR of 18.1% from 2009. Furthermore, China’s orthopedic implant market is estimated to move from the third largest in 2010 to the second largest in 2015, surpassing Japan.
With rapid domestic economic growth and rising per capita disposable income in China, medical treatment and products are becoming increasingly affordable. Notably, according to Frost & Sullivan, China’s per capita healthcare expenditure in 2007 was only US $112, compared to the United States’ per capita healthcare expenditure of US $7290. China’s overall healthcare expenditure represented only 4.8% of its GDP in 2007, compared to 16.0% of the GDP in the United States. Recently, the Chinese government unveiled a RMB 850 billion (approximately US $125 billion) three-year spending plan to improve the healthcare infrastructure and expand insurance coverage in China.
 By 2011, healthcare reform is expected to enable more than 90% of Chinese citizens to obtain basic medical insurance. The reform will continue to expand the accessibility and affordability of Kanghui Holdings’s products beyond the top tier cities in China.
The domestic orthopedic implant market is also driven by the aging population. Elderly patients have an increased susceptibility to many conditions that require orthopedic surgery.  For example, fractures by osteoporosis and degenerative diseases, more commonly seen in the elderly, are the primary reasons for patients to undergo trauma or spine surgeries using products developed by KH. The United Nations projects over 400 million, or nearly 35% of the Chinese population, are expected to be over 60 years old, while nearly 70 million people over 50 years old in China now have osteoporosis conditions in the year 2006. The growing and aging population and increased need for orthopedic care will drive the revenue growth of KH in the years ahead.
It is remarkable that the orthopedic implantation rates in China is 100 times lower relative to the rates in the United States. The low implantation rate in China leaves significant room for additional growth in the Chinese orthopedic implant market in the future.
On July 31, 2008, Kanghui Holdings acquired Beijing Libeier for the sum of RMB 182.7 million. This acquisition complemented Kanghui’s existing network of distributors, brought 83 new distributors and contributed to the net revenues. In China, health care manufacturers sell products to third-party distributors, who in turn sell those products directly to hospitals or through sub-distributors. As of June 30, 2010, KH had built a strong domestic network of 237 distributors for their products covering 30 of the 31 provinces, municipalities and autonomous regions in China. Kanghui Holdings (KH) has a global network of 27 distributors in 24 countries across Asia, Europe, South America and Africa. Moreover, Zero2IPO, the most prestigious integrated service provider in the field of VC and PE, selected Kanghui Holdings as No. 1 in the “Zero2IPO-Venture 50 Awards” in 2008. In 2009, Forbes released the “Potential of Enterprises in China 2009 Forbes List” and Kanghui Holdings was ranked No. 4 among 200 rapidly growing SMEs in China.
In the Chinese market, KH’s direct competitors include Shandong Weigao Group, Medical Polymer Company Limited (Weigao) and other leading international orthopedic implant manufacturers, such as Johnson & Johnson and Medtronic. Weigao (8199.HK) is listed in the Hong Kong Stock Market with a much higher P/E of ~50.
To compete with global companies, Kanghui Holdings has strong research and development capabilities that focuses on developing new proprietary products. Since 2008, nine new products (four trauma products and five spine products) have been released and seven more are expected to be released by the end of 2011. KH has also received government incentives and subsidies from time to time. The company has received numerous awards from central, state, and local governments, including more than RMB 100 million from the Innovation Fund of the National Ministry of Science and Technology in China. In addition to internal efforts, KH collaborates with the Institute of Metal Research of the Chinese Academy of Sciences to perform strategic research and product developments. A post-doctoral research program was also established at KH’s research and development center and graduates from top universities in China were recruited.
The company showed strong financial results for the quarter ended June 30, 2010. 
·         Net revenue increased by 29.4% to RMB58.1 million (US$8.6 million) in the second quarter of 2010 from RMB44.9 million in the second quarter of 2009.
·         Gross profit increased by 25.6% to RMB38.8 million (US$5.6 million) in the second quarter of 2010 from RMB30.9 million in the second quarter of 2009.
·         Net income was RMB27.7 million (US$4.1 million) in the second quarter of 2010, representing 47.7% of our net revenue, compared to RMB20.9 million in the second quarter of 2009, representing 46.5% of our net revenue.
·         Net revenues grew from RMB139.6 million in 2008 to RMB184.3 million (USD $27.0 million) in 2009 at a CAGR of 32%. Net income grew from RMB60 million in 2008 to RMB75.0 million (US $11.0 million) in 2009 at a CAGR of 25%.
The company has launched its IPO and offered 5,340,000 ADSs on August 11, 2010. Each ADS represents six of its ordinary shares, so its P/E should be calculated ~13 compared to the industry average of 20. The joint bookrunners for KH are Morgan Stanley (MS) and Piper Jaffray (PJC). Once the reticent period ends, more analysts will begin to add coverage for this stock, and that will be an optimistic sign for KH. I believe KH will continue to generate value for shareholders due to the increasing portion of the people in China, who can afford high-quality orthopedic implants and the growing emphasis on health coverage from the Chinese government.

Monday, September 6, 2010

Six Reasons to Buy AMBO

Located in China, Ambow Education Holding Ltd. (NYSE: AMBO) is a leading national provider of educational and career enhancement services, offering high-quality, individualized services and products. Despite its weak performance in August, I believe AMBO is a well-undervalued stock for the following reasons:

1) China overtook Japan as the world’s second-largest economy during the second quarter of 2010 in terms of gross domestic product (GDP), and that is expected to grow to over $20 trillion by 2014. According to IDC, total spending in China’s education market was $236.3 billion in 2008 and is projected to grow by approximately $604.1 billion by 2013. Because of the growth in the rapid economy and disposable household income, people in China are increasingly willing to invest in higher and professional education as it may lead to better career opportunities and enhanced earning power.

2) AMBO started its business with a clear mindset on focusing on the education training market. In the past ten years, AMBO has adhered to its goals and addressed two critical demands in China’s education market: the desire for students to be admitted into top secondary and post-secondary schools (Better Schools) and the desire for graduates of those schools to obtain more attractive jobs (Better Jobs).

“Better Schools” refers to the K-12 programs and tutoring services with a standards-based curriculum that enables students to improve their academic results and educational opportunities. According to IDC and CCID, AMBO is the largest ZhongKao and GaoKao after-school tutoring provider in China both in 2008 and 2009. Both administered in China, “ZhongKao” refers to high school entrance exams while “GaoKao” refers to university entrance exams. Like graduates from Ivy League schools in the United States, graduates from top universities in China may have a better chance to obtain quality jobs.

“Better Jobs” refers to the career enhancement services programs that facilitate post-secondary students in obtaining more attractive employment. They are offered through AMBO’s career enhancement regional service hubs, which are strategically located in key economic centers across China.
According to IDC and CCD, AMBO was the largest IT career enhancement training provider in China both in 2008 and 2009. Some key partnerships include Cisco Systems, Inc., Skillsoft Asia Pacific and McGraw-Hill Education.

3) Perhaps the biggest competitor for AMBO in China is New Oriental (EDU). However, New Oriental only focuses on English and other foreign language training and providing consulting services to help students through the application and admission process for overseas educational institutions. Unlike New Oriental, AMBO focuses on targeted markets within the educational and career enhancement services market. Moreover, none of AMBO’s competitors can compete with its broad spectrum of programs, services and products.

4) AMBO has experienced substantial growth in net revenues and profitability in recent years. Its revenues grew from RMB 318.9 million in 2007 to RMB 902.0 million (USD $132.1 million) in 2009 at a CAGR of 68% over the last two years. Its net income grew from RMB 34.2 million in 2007 to RMB 138.0 million (US $20.2 million) in 2009 at a CAGR of 101% over last two years. In addition to organic growth, AMBO switched to new product sales in May 2008. Under this new business model, AMBO has no obligation to students or schools and has phased out its previous model of providing services to students of schools and centers that are not directly operated by AMBO. Under this new product sales model that alters sales to distributors, less net revenue per sale may be recognized, but higher gross margins are expected.

5) AMBO has built its Ambow brand and increased awareness of its products and services in a capital efficient way. AMBO has received numerous awards from notable organizations in China and is consistently ranked as one of China’s top ten education brands by industry leaders such as the China Daily Media Group, Tencent and Sohu.com. On August 11th, 2010, BusinessWeek announced its “50 Green Companies in China” award and AMBO was the only company from the education industry, while the other recipients included Intel (China), Coca-Cola (China), Shell (China), Ford Motor (China), Sony (China), etc. In my opinion it is remarkable to see that the education sector can also be green (i.e. low carbon). “We believe that Green has become one of the key concepts in the development of AMBO’s educational systems over the last three years. Our intelligent system, which combines the learning engine and robust content, along with the use of IT management system has proved to be a good way to improve the efficiency of our educational services and consistent with Low-Carbon Economy,” said Yisi Gu, AMBO’s Senior Vice President and Chief Technology Officer (CTO).

6) The joint bookrunners for AMBO are J.P. Morgan Securities Inc. and Goldman Sachs (Asia) L.L.C. There used to be a quiet period after IPOs, and a Chinese wall rule prevented analysts working at those firms from speaking or writing reports for twenty-five business days from the listing. Once the period ends, more analysts will begin to add coverage for this stock and that will be an optimistic sign for AMBO.

AMBO currently has a P/E ~ 27 and P/B ~ 2.1, compared to New Oriental (EDU)’s P/E ~51 and P/B ~ 8.9, which offers a very attractive investment opportunity. As a significant part of AMBO’s growth strategy, AMBO has completed a number of acquisitions, and I believe AMBO intends to continue making strategic acquisitions and investments to help fuel future growth.

Wednesday, September 1, 2010

When labor day approaches, will we see holiday effect again?


There are nine holidays each year during which the exchanges are closed. Empirical research suggests that stock prices often behave in a specific manner one day before these holidays. By being aware of this behavior, both long-term investors and short-term traders can benefit.


The general strategy for short-term traders is to purchase equities one day prior to a holiday and sell just after the holiday. The theory behind this effect is that traders, to avoid any unexpected bad news with market impact, try to unload their holdings before the holidays. Selling pressure drives prices down and makes most stocks become attractive when the holiday ends.

Based on the S&P 500 Index, the list below shows the results for this strategy over the last 20 years:


YearBuy one day before,  sell right after Labor Day
19900.16%
1991-0.83%
19920.46%
1993-0.61%
19940.18%
19950.95%
19960.42%
19973.13%
19985.09%
1999-0.50%
2000-0.90%
2001-0.06%
2002-4.15%
20031.39%
20040.69%
20051.26%
20060.17%
20071.05%
2008-0.41%
20090.88%


Thirteen out of twenty records show positive returns, and the probability of success in the past 20 years was 65 percent. As Labor Day approaches, will we see history repeat itself?

NEWN: A Hidden Gem with Strong Foundations for Growth

As a value investor, I am always looking for companies with great fundamentals and growth potential. By running my daily screen, a long candidate has attracted my eyeballs.


It is New Energy Systems Group (Amex: NEWN). NEWN is a leading provider of lithium-ion batteries for portable electronic devices in China with headquarters in Shenzhen, Guangdong Province, which is China's first—and arguably one of the most successful—Special Economic Zones. This company has recently been uplisted to Amex from OTCBB and traded in the range of $6-7.


In recent years, the global output of lithium-ion batteries has soared more than 50% annually and the demand is expected maintain its upward momentum till 2018. At present, the global supply of Li-ion batteries is monopolized by three giants in Asia, i.e. China, Japan and South Korea, and all three have a total market share surpassing 95%.


The first use of lithium batteries was in laptops, but now they are widely used in cell phones, video machines, digital cameras, MP3 players, hybrid cars and other electronic products. The batteries are becoming more environment-friendly with a longer life, smaller size and lighter weight. Chinese Li-ion battery manufacturers are not only seizing market share for Li-ion batteries for portable products like 3G mobiles and laptops from South Korea and Japanese competitors, but also are actively developing the Li-ion battery market for electric cars and E-bicycles.


In China, the fastest-growing auto market in the world, the development of Li-ion batteries has become a core part of the development of hybrid cars. The Chinese government has recently handed out policy incentives to encourage more electric cars on the road and the demand for Li-ion batteries will increase. Investments into companies in the battery business will reward investors generously. In fact, this is already reflected in the Shanghai A-share market. Most Chinese battery companies listed in the A-share market have advanced more than 20% since August 1, 2010, with an incredible 100% net income increase in the first six months of 2010.


Products from NEWN now support iPhones, iPads, Blackberrys and all major-brand cell phones, laptops, digital cameras, MP3s, etc. Currently, NEWN only operates at around 50% of manufacturing capacity and has begun to expand internationally. On Aug. 26th, 2010, NEWN announced its plan to launch MeePower™, a new brand of advanced battery backup systems and expected them to be available to distributors in the U.S. beginning in the fall of 2010. MeePower generates 4–7 times more power than an original OEM battery’s capacity and can recharge the OEM battery more quickly and last longer.


In the past, the company only dealt in the low-margin battery shell & cap and battery-distribution businesses. But acquisitions in 2009 transformed NEWN into a rapidly-growing, high-margin, integrated manufacturer with an established brand name.


The first acquisition was of Anytone, a manufacturer and seller of lithium-ion battery finished products and was acquired by NEWN with both stock shares and cash payments. The acquisition not only enhances NEWN’s ability to rapidly innovate with quick-turn capabilities with over 30 patents and deep R&D capabilities, but also broadens product offering and allows NEWN to touch end-user customers.


Another acquisition was with NewPower, a China-based manufacturer of lithium-ion batteries. NewPower has extensive manufacturing expertise and capabilities. It only operates at 50% of production capacity and can triple its production with minimal additional capital expenditures. Both acquisitions are strategically important to vertical integration and increase profitability of the existing battery distribution business with added margin by internally sourcing lithium-ion batteries.


Although the company’s cash positions are influenced by its payments for the acquisitions, NEWN still shows strong second-quarter earnings. The company’s revenue has increased 335.2% to ~23.4 million and gross profit increased 280.1% to ~$6.1 million year over year. A final payment of $4.0 million is related to the Anytone acquisition and reduced account payable and accrued expenses on its balance sheet. Its adjusted EPS has increased 59.1% to $0.35 per diluted share and the company has affirmed its goal to earn at least $1.23 per diluted share in 2010. A conservative 10X P/E valuation gives an intrinsic value of $12.3 for NEWN, which is well beyond the current price level. Lastly, the company is still expanding and operating only at 50% of its capacity.


The latest 10-Q also shows that the stock value of NEWN paying for both acquisitions is ~6.4 dollars. NEWN has only 35,000 outstanding stock options with an exercise price of 6.19 and outstanding shares of ~11.86 million. The current price of $6.15 for NEWN is extremely cheap, with a trailing 12 month P/E of 5.6.


What worries most investors of small cap Chinese companies is dilution, especially when the companies are eager to raise capital with a secondary offering. However, as NEWN has just completed two acquisitions with a healthy balance sheet, the chance of a secondary offering is very slim.


NEWN has now completed its acquisitions and integrated its business lines. The company has transformed into a fully-integrated manufacturer with a brand name and is focused on growing its business in both China and overseas markets. The company will continue to introduce new products to meet changing market demand and increase higher margin direct sales to OEM customers and retail partners. NEWN is on its way to expand into large, higher-margin international markets such as North America, Europe and Japan. The management teams of NEWN have accumulated abundant knowledge about the battery industry and built a strong distribution network for years.

I believe that NEWN will continue to experience organic growth in the years ahead and will generate value for shareholders while maintaining high corporate governance standards.

Write OTM puts for companies with short attack!

This strategy works well today for CHBT.

Write your puts to let market against you!

It is well- known that options are like double-edged swords. If you use them well, they will earn much higher profits than your investments in stocks. If you are clueless about how to use them, you lose your money and a margin call might be in front of you.

What I want to discuss today is how to let the market fight against you instead of you fighting against market.

Be thankful for the options and their liquidity provided by day-to-day market-makers (MM).

The option traders try to hedge their risks through delta and gamma. These two terms are first mathematical in nature and second, derivatives of the underlying stock prices. We don't need to discuss them in a quant manner, but what you need to remember is that option traders always hedge their positions.

What does this mean? When they buy some options, they short underlying stocks according to some calculated numbers. When they short options, they long their stocks.

It's clear to see that when short-squeezing happens, option traders find it difficult to do an "exact hedge" and the option prices may simply go in one direction only.

This is what I did last Friday after I received a flash alert to buy SCOK from a subscription.


SinoCoking Coal & Coke Chemical Industries, Inc. (SCOK) produces and markets coal products, including coke, raw and washed coal and chemical byproducts in the People's Republic of China.

This company was oversold in the middle of August, 2010 and people overreacted to the bad news.

After carefully examining the fundamentals and speaking with some analysts, I am ready to enter with a catalyst. Ten minutes before the market closed on August 20th,2010, I received a flash alert urging people to buy SCOK, and that really drove the price up by 10% during the last five minutes. To profit from this rally and limit my risks, I sold some 10 Sep 2010 Puts at 1.6$. I begin to sell the options right after rally, as it is rare for the stock to drop below 10. By writing the options, I earn both time decay and value depreciations at the same time. (When you write options, you receive fees upfront and expect to receive all of them when it runs out of money.)

On August 23rd, 2010, I closed all of my Put positions by buying them back at about $1.05$. Because of uncertainties, it is not recommended to hold your option positions for too long. This made me a quick return of more than 30%; compare this to the 15% one can expect when fully invested in stocks.

Other successful examples are selling 9 Aug 2010 Puts for RINO and 10 Aug 2010 Puts for CAGC. Both of these are companies with good fundamentals that I like very much. Their values are hard to beat below those levels.


Small-cap companies' stocks are very volatile, so their OTM options may always bear more premiums compared to their large-cap peers. (Option theory tells us that this is called volatility smile, but that is beyond the scope of our current discussion.) Because of this, selling deep OTM options for companies with good fundamentals is an effective way to earn high yields each month.

Hedge your small-cap portfolio with ETF!

2009 has proved to be a good year for most hedge funds dealing with fundamentals and I would expect the trend continues.


A fundamentalist take a closer a look at the firms with healthy balance sheet, attending the conference call and doing due deligence to understand the companies' business modes.

This has helped me to pay special attention to Chinese Small-Cap companies.

Most Small-Cap Chinese firms are ignored by investors because culture and disbelief of growth in China.

In my opinion, these firms are really good investment candidates with healthy balance sheet and almost zero debts. They are growing companies with Revenue growth >100% year over year, low p/E around 6-7 and high profit margin, >30%.

Although people may surpass these companies by tellling that "Chinese are liars and they cook the books", I regarded them to be good candidates and did my own research to identify the good ones.

The efforts always pay back and the good news is that it's easy to hedge the risks of these small-cap stocks by shorting the ETF.

For example, one ETF (HAO) is created for China Small Cap companies.

A regression of CBPO agansit HAO gives a R2 >50%, which is pretty good for the model. A more caeful work has been performed for GFRE, YONG, etc and all suggest that the movements of these stocks are closely related to the index.


When you are not sure and worrying about your holdings of Chinese Small Cap companies, don't sell them immediately but short the index to hedge!